
Using Dashboard Reports
This guide is for the people who read the admin dashboard: owners and editors who want to see at a glance how publishing is going and whether any pages need attention. No technical knowledge needed. Dashboard Reports adds two cards to your admin dashboard and, if you want it, a regular email with the same numbers. Every step uses the labels you see on screen.
Using Dashboard Reports (how-to)
Section titled “Using Dashboard Reports (how-to)”How to read the Publishing trend card
Section titled “How to read the Publishing trend card”- Open your admin dashboard. This is the first screen you see when you sign in.
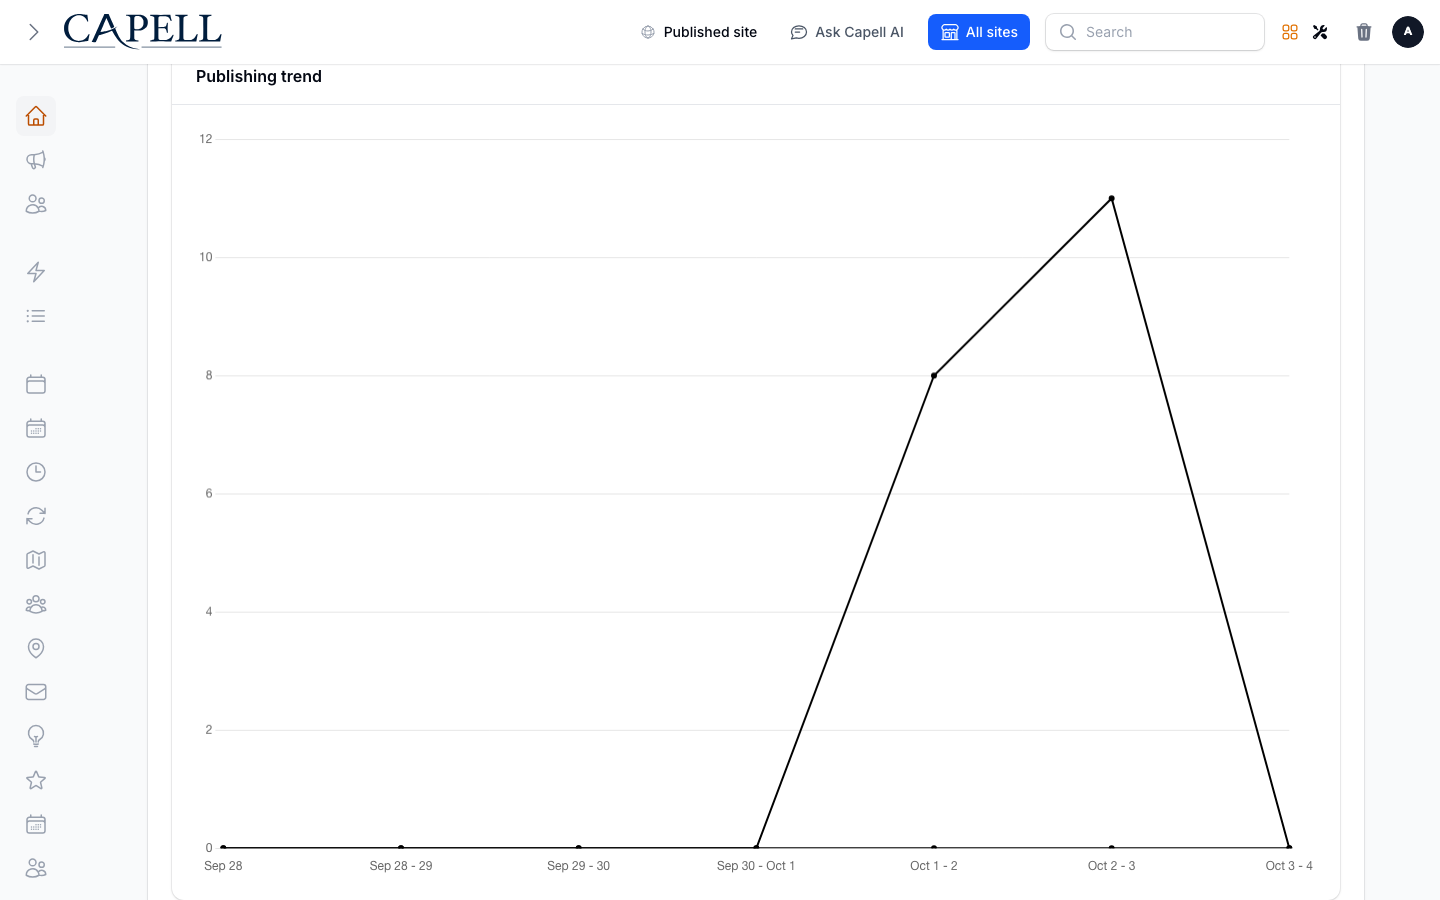
- Find the Publishing trend card.
- The card shows two series over the current reporting window: Published pages (pages that went live) and Scheduled pages (pages set to go live later).
- Compare the two to see whether your team has been publishing more or less than usual, and how much is still queued up to go out.
How to read the Content health card
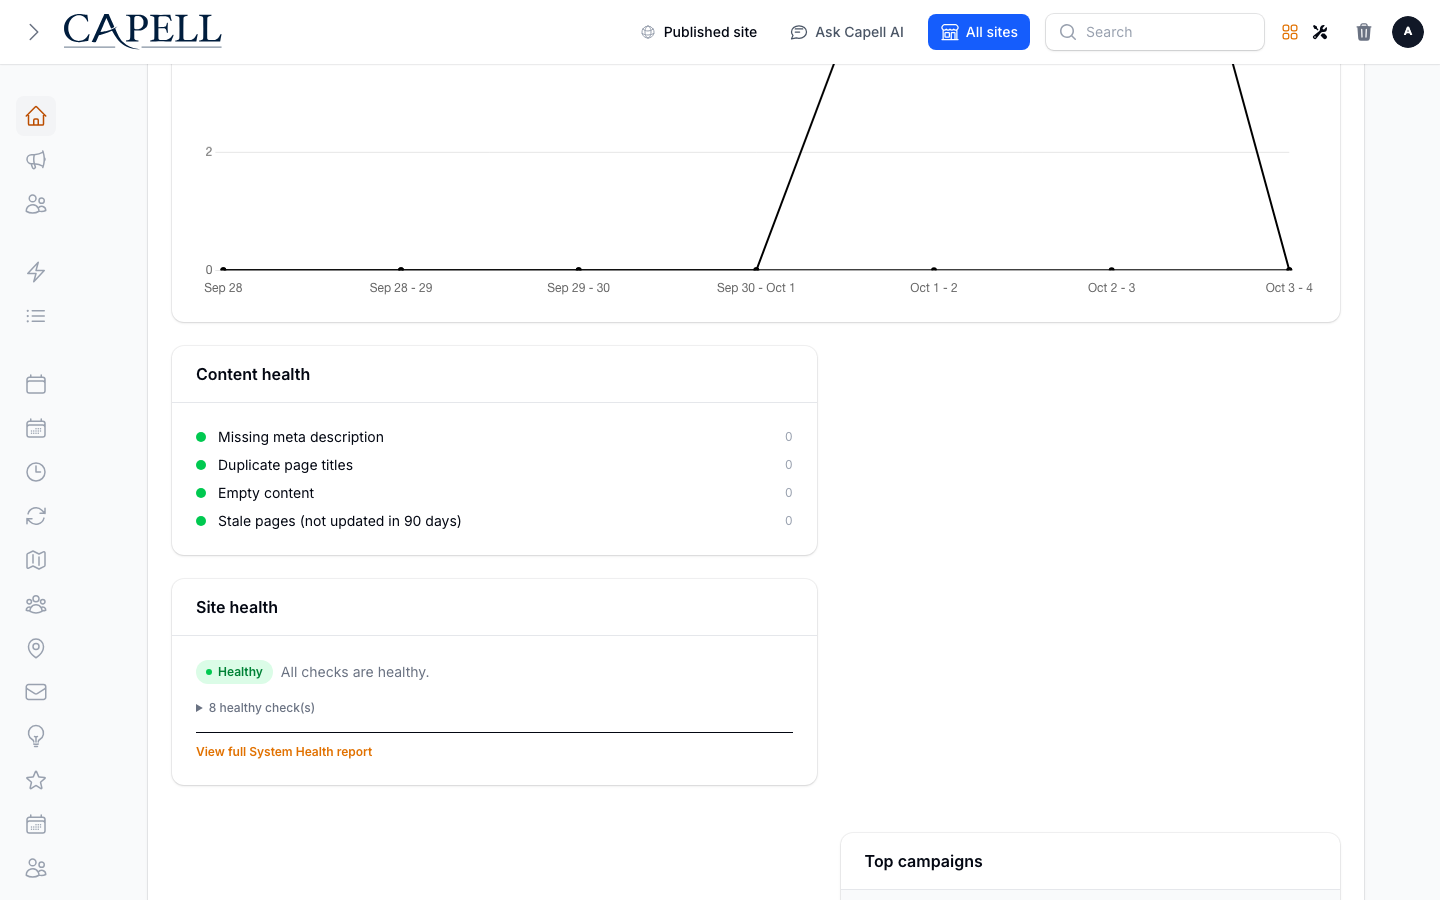
Section titled “How to read the Content health card”- On the admin dashboard, find the Content health card.
- It lists pages that may need attention, grouped by issue: Expired pages, Pages without URLs, Scheduled pages, and Stale pages.
- Each issue shows how many pages it affects. A count of zero means nothing to do for that issue.
- Use this card as your daily or weekly check before a publishing review.
How to act on content health issues
Section titled “How to act on content health issues”- On the Content health card, note which issue has a count above zero, for example Expired pages or Stale pages.
- Go to your page list.
- Use the Content health filter at the top of the list to show only the pages flagged for that issue.
- Open each flagged page and fix what it needs: give a page without a URL a proper address, refresh a stale page, or review an expired one.
- Come back to the dashboard later to confirm the count has gone down.
How to show or hide each card
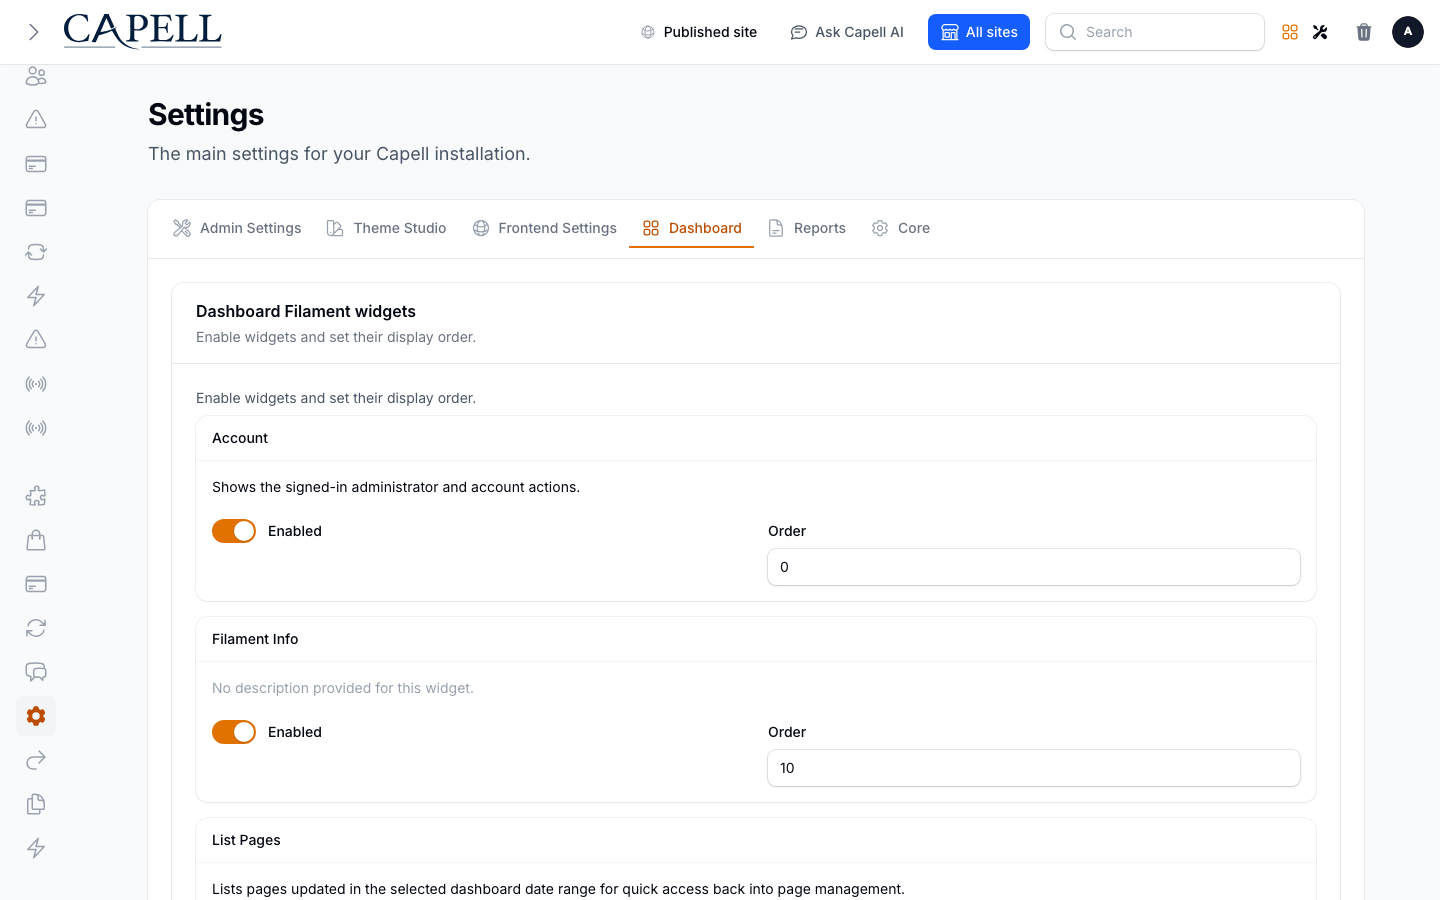
Section titled “How to show or hide each card”- Go to your dashboard settings.
- Find the Dashboard Reports group.
- Turn Publishing trend on or off, and turn Content health on or off, depending on what you want to see.
- Save. The cards you turned off no longer appear on the dashboard, so it stays focused on what matters to you.
How to request an export or digest
Section titled “How to request an export or digest”CSV exports and digest emails are provided through operational commands rather than dashboard buttons. Ask your developer to run or schedule them when needed.
- An export can contain the underlying content-health or publishing-trend data for an authorised administrator’s site scope.
- A digest uses configured recipients and its requested reporting range; it is not enabled from the dashboard settings screen.
- Review the dashboard first, then give your developer the report type, date range, and intended recipients or file destination.
Rolling out Dashboard Reports (for owners)
Section titled “Rolling out Dashboard Reports (for owners)”Turn on first
Section titled “Turn on first”- Content health. This is the card that tells you when something needs fixing. Start here so your team gets in the habit of clearing flagged pages.
Add when needed
Section titled “Add when needed”| Need | Enable |
|---|---|
| See how publishing activity is trending | The Publishing trend card |
| Spot pages that need attention before a review | The Content health card |
| Get the numbers without opening the admin | A developer-scheduled Dashboard Reports digest |
| Keep a record or build your own chart | A developer-run CSV export of the report data |
Keep it focused
Section titled “Keep it focused”- Use the Dashboard Reports settings group to hide any card a given team does not use. A dashboard with only the cards people act on gets read more often than a cluttered one.
Who does what
Section titled “Who does what”| Role | First useful screen |
|---|---|
| Editor | The dashboard Content health card: see what needs fixing, then open the pages |
| Site owner | The dashboard Publishing trend card: see whether publishing is keeping pace |
Troubleshooting
Section titled “Troubleshooting”| What you see | What it means | What to do |
|---|---|---|
| Publishing trend is missing from the dashboard | It is disabled in settings or unavailable to your role | Open the Dashboard Reports settings group and turn it on; ask an administrator to check role access |
| Content health is missing from the dashboard | It is disabled, unavailable to your role, or there are no current issues | Check its dashboard setting and role access; no card is shown when its issue count is zero |
| Content health shows pages without URLs | Those pages have no public address yet | Filter the page list by Content health, open each page, and give it a URL |
| Stale pages count keeps growing | Pages have not been updated in a while | Filter for them, review the content, and refresh or retire each one |
| A number on a card looks wrong | The card counts a specific thing over the current reporting window | Open the page list and use the Content health filter to see the exact pages behind the count |
| The Published pages line looks flat | Little has gone live in this window, or work is still Scheduled | Check the Scheduled pages series to see what is queued to publish later |
| No Dashboard Reports digest email | No recipients or schedule may be configured, or the command has not run | Ask your developer to check the configured recipients and scheduled digest command |