
Using Diagnostics
This guide is for the people who keep the site running: operators who check whether everything is healthy before and after a release, and the developers they work with. Diagnostics gives you health panels you can read at a glance, plus a few screens that let you run maintenance tasks safely. The health panels are read-only, so looking at them changes nothing. Two screens, the Command Palette and Queue Operations, do take action, so this guide tells you exactly when that happens. Green means healthy. A warning or failure means something needs attention. Every step uses the labels you see on screen.
Using Diagnostics (how-to)
Section titled “Using Diagnostics (how-to)”How to read the health widgets on your admin dashboard
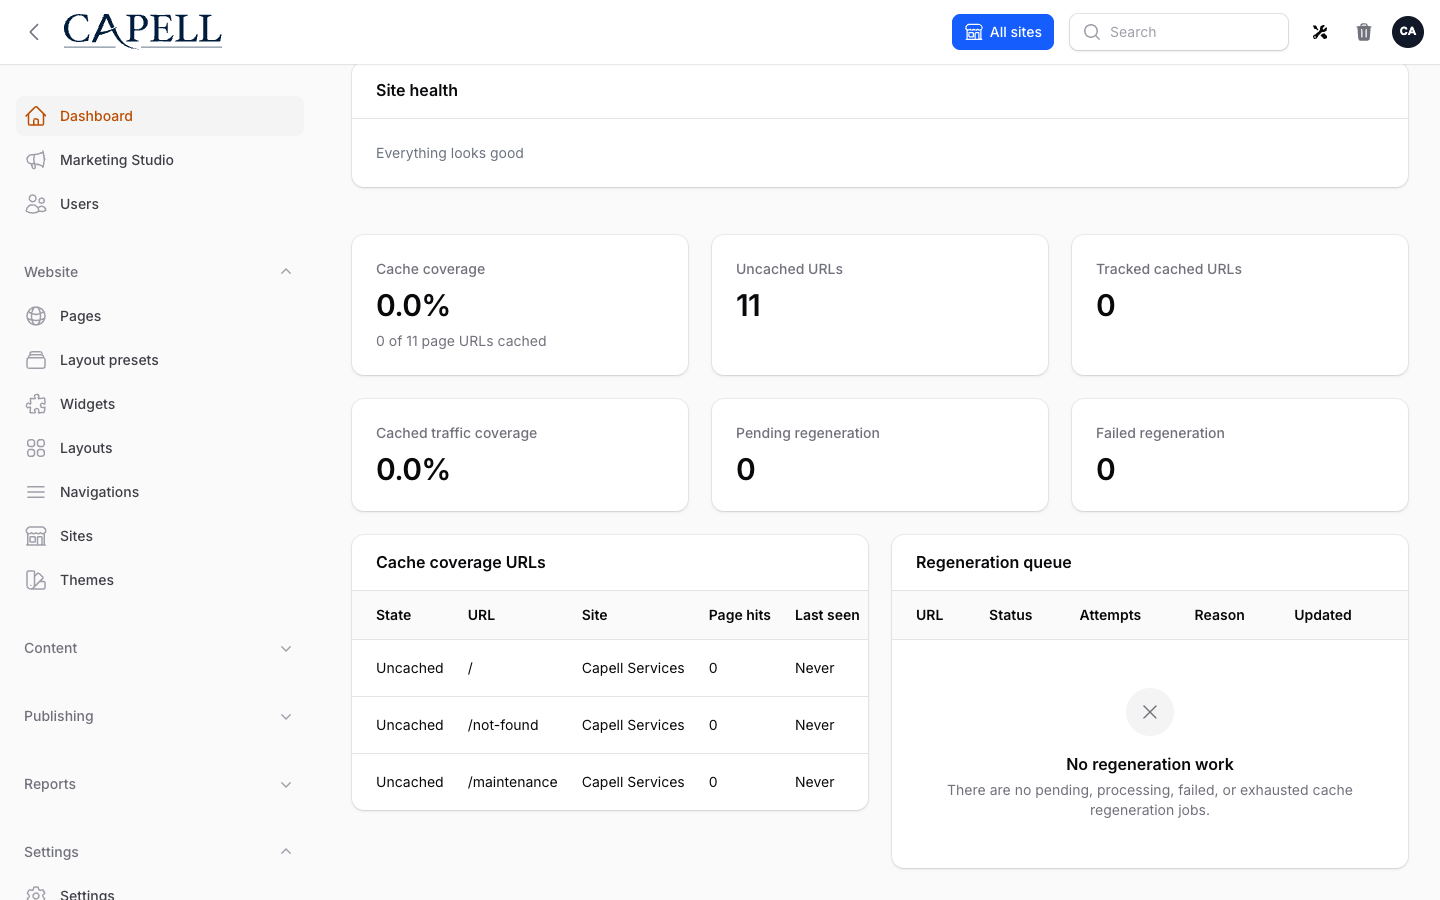
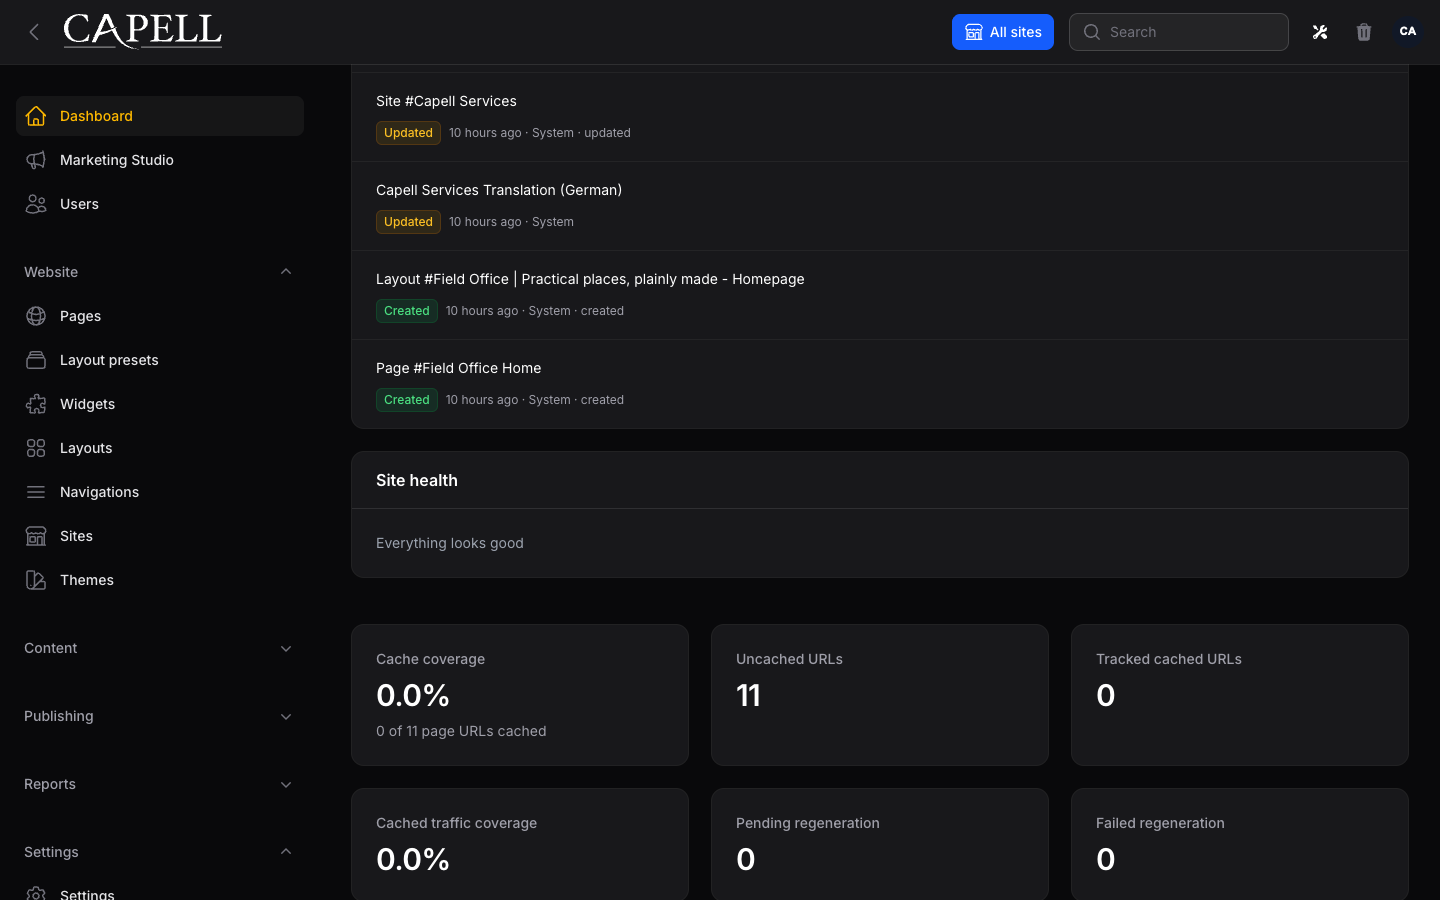
Section titled “How to read the health widgets on your admin dashboard”- Open your admin dashboard. The health widgets are grouped together near the top.
- Read each panel and check its colour. Green means that area is healthy. A warning or failure colour means it needs attention.
- The panels you will see are Setup health, Cache health, Migrations health, Registry health, Config drift, Content health, Content graph, Tailwind build status, Packages installed, and Public output safety.
- Setup health lists any Items to complete:. When there is nothing outstanding it shows “All setup requirements met!”.
- If a panel is green, there is nothing to do. If a panel warns or fails and you are not sure what it means, note the panel name and its message and send it to your developer.
How to review System health
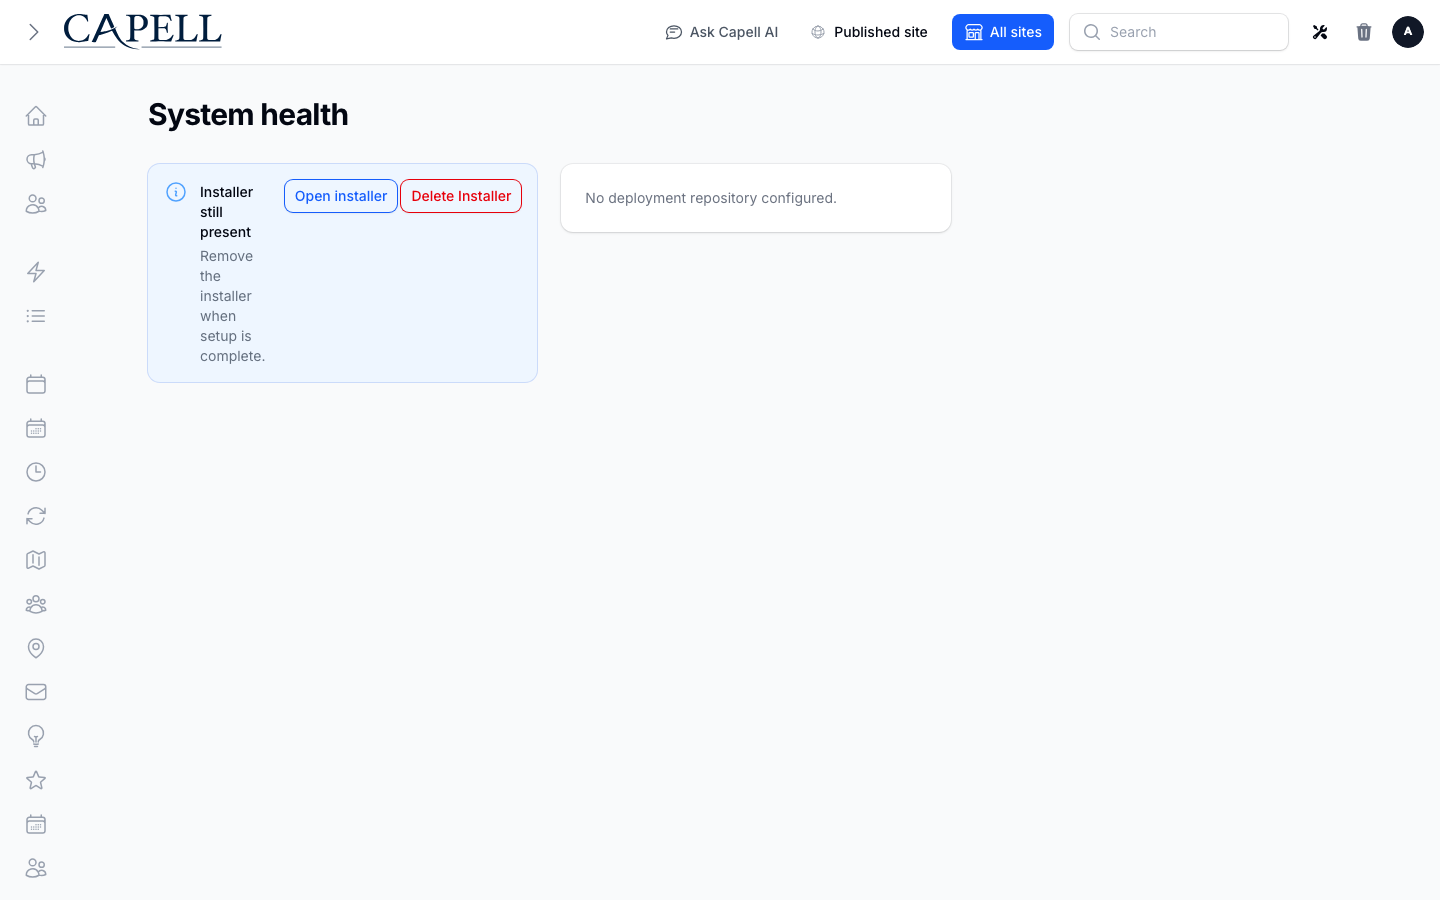
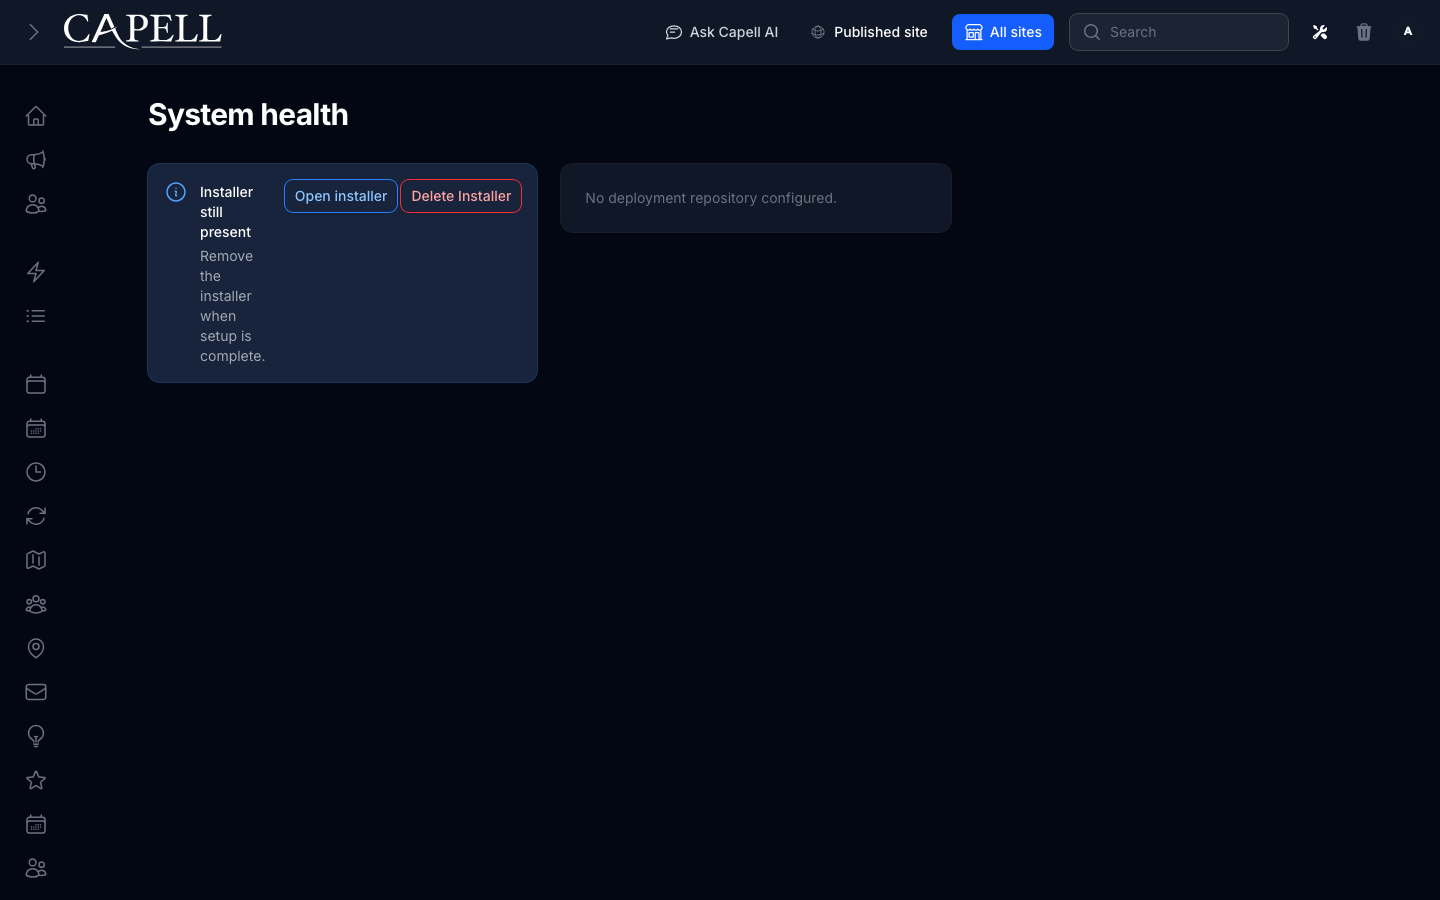
Section titled “How to review System health”- Go to System health.
- Read each panel the same way as on the dashboard: green is healthy, a warning or failure needs attention.
- Use this screen as your first stop before you change package setup, run a deployment, or alter publishing configuration. It gives you the full picture in one place.
- If something fails, decide whether it is a thing you can fix yourself (described in the panel) or a thing for a developer, then act or escalate.
How to warm the cache from Cache health
Section titled “How to warm the cache from Cache health”- Find the Cache health panel, either on your dashboard or on System health.
- Click Warm cache.
- The button shows Warming… while it works. When it finishes it shows Last warmed: followed by the time it ran.
- Warming the cache is safe to do at any time. It refreshes cached data so the next visitor gets an up-to-date page.
How to check pending migrations
Section titled “How to check pending migrations”- Find the Migrations health panel on your dashboard or on System health.
- Read the status. When everything is up to date it shows All migrated along with the Last batch: that ran.
- If it shows Pending migrations, the database has changes waiting to be applied. This usually follows a deployment and is a job for your developer.
- If it shows Orphaned registrations, a registered migration no longer matches the files on the site. Note this and pass it to your developer.
How to review installed packages on the developer tools dashboard
Section titled “How to review installed packages on the developer tools dashboard”- Go to Diagnostics to open the developer tools dashboard.
- Find the Packages installed panel. It lists each package with columns for Package, Version, Bundle, Commands, Health, Docs, Admin guide, and README.
- The Health column tells you at a glance whether each package is in good shape.
- Each package shows whether its configuration is Config published or Not published. “Not published” means the package is using its shipped defaults, which is normal unless you meant to customise it.
- Use the Docs, Admin guide, and README links to open a package’s documentation when you need more detail.
How to run a maintenance command from the Command Palette
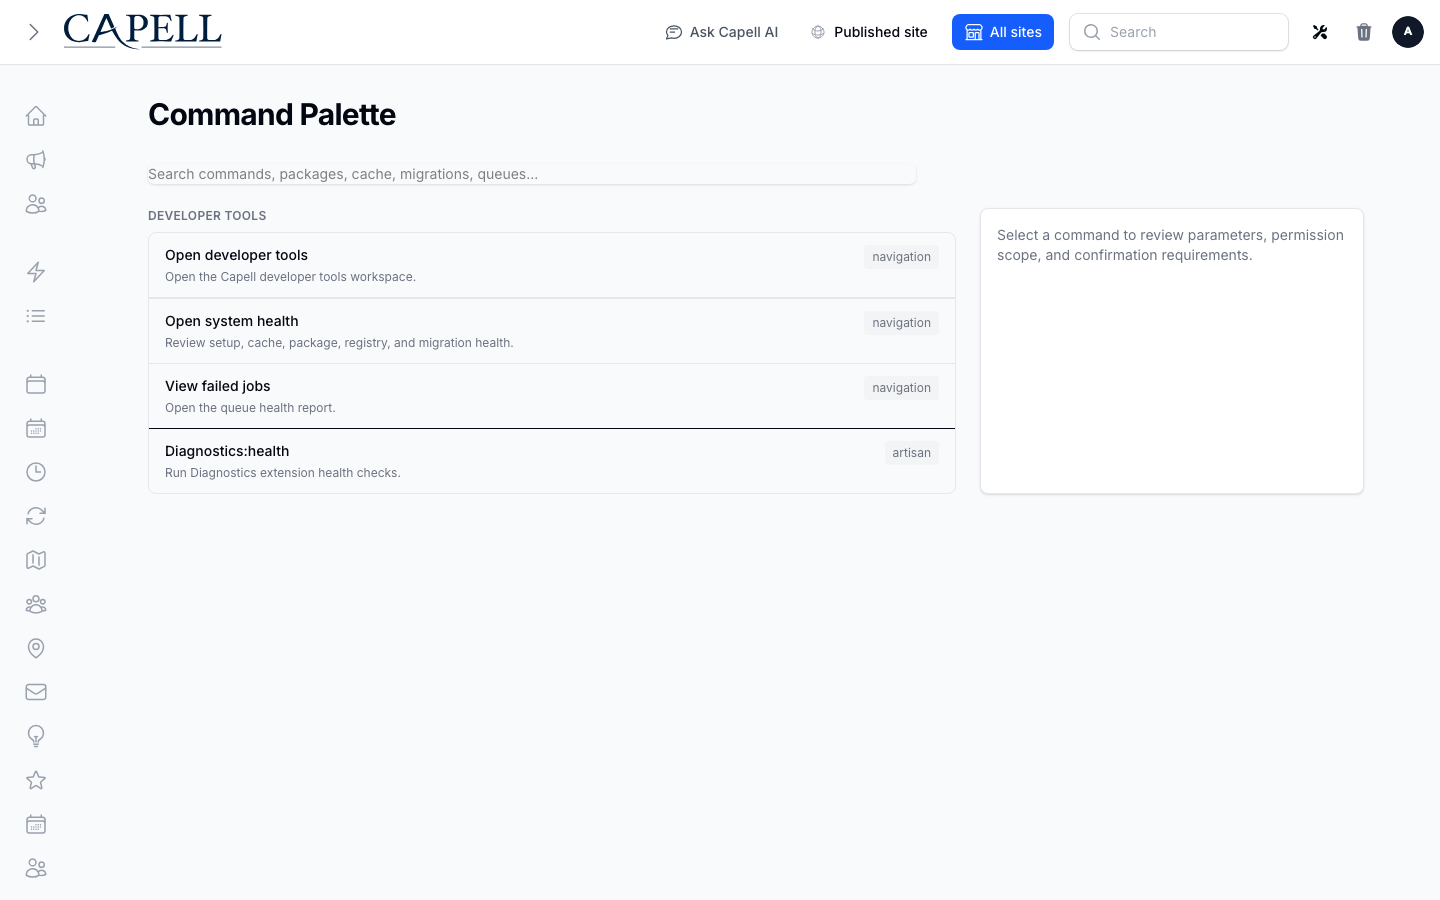
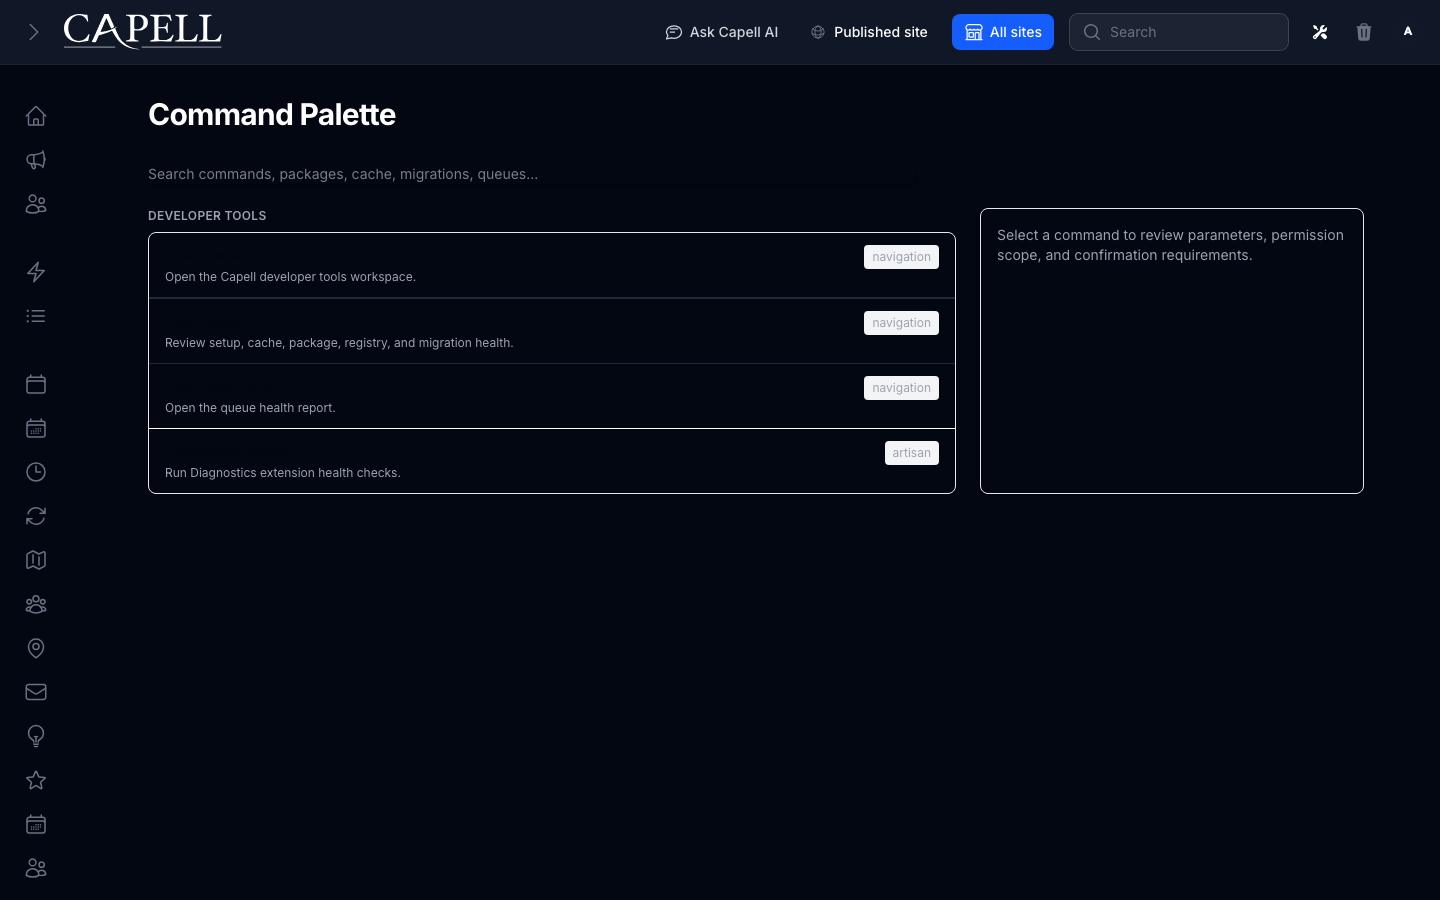
Section titled “How to run a maintenance command from the Command Palette”- Go to Command Palette.
- In the search box (placeholder “Search commands, packages, cache, migrations…”), type what you are looking for. Results are grouped under Developer tools and Commands.
- Pick a result. The screen prompts you to Select a command to review parameters, permission scope, and confirmation requirements. so you can see exactly what the command does before running it.
- Fill in any parameters the command asks for.
- If the command needs confirmation, you will see “This operational command requires confirmation before it runs.” For commands that make wider changes you will also see “This command may make broad or destructive operational changes.”
- When a command requires confirmation, tick the checkbox “I understand this command will run on this application.”
- Click Run to run it, or Cancel to back out without running anything.
How to audit permissions and roles
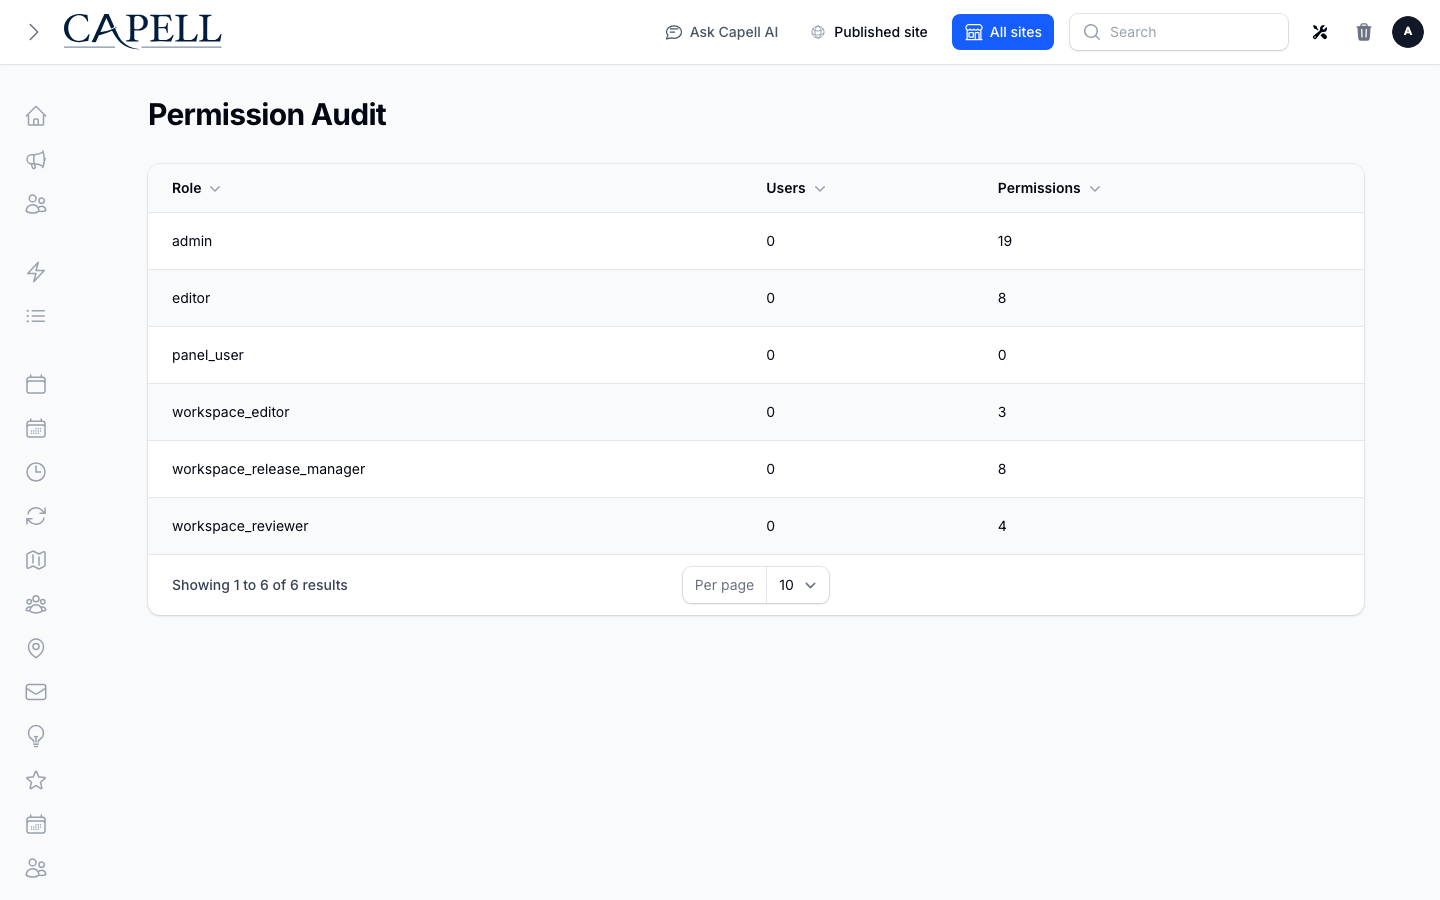
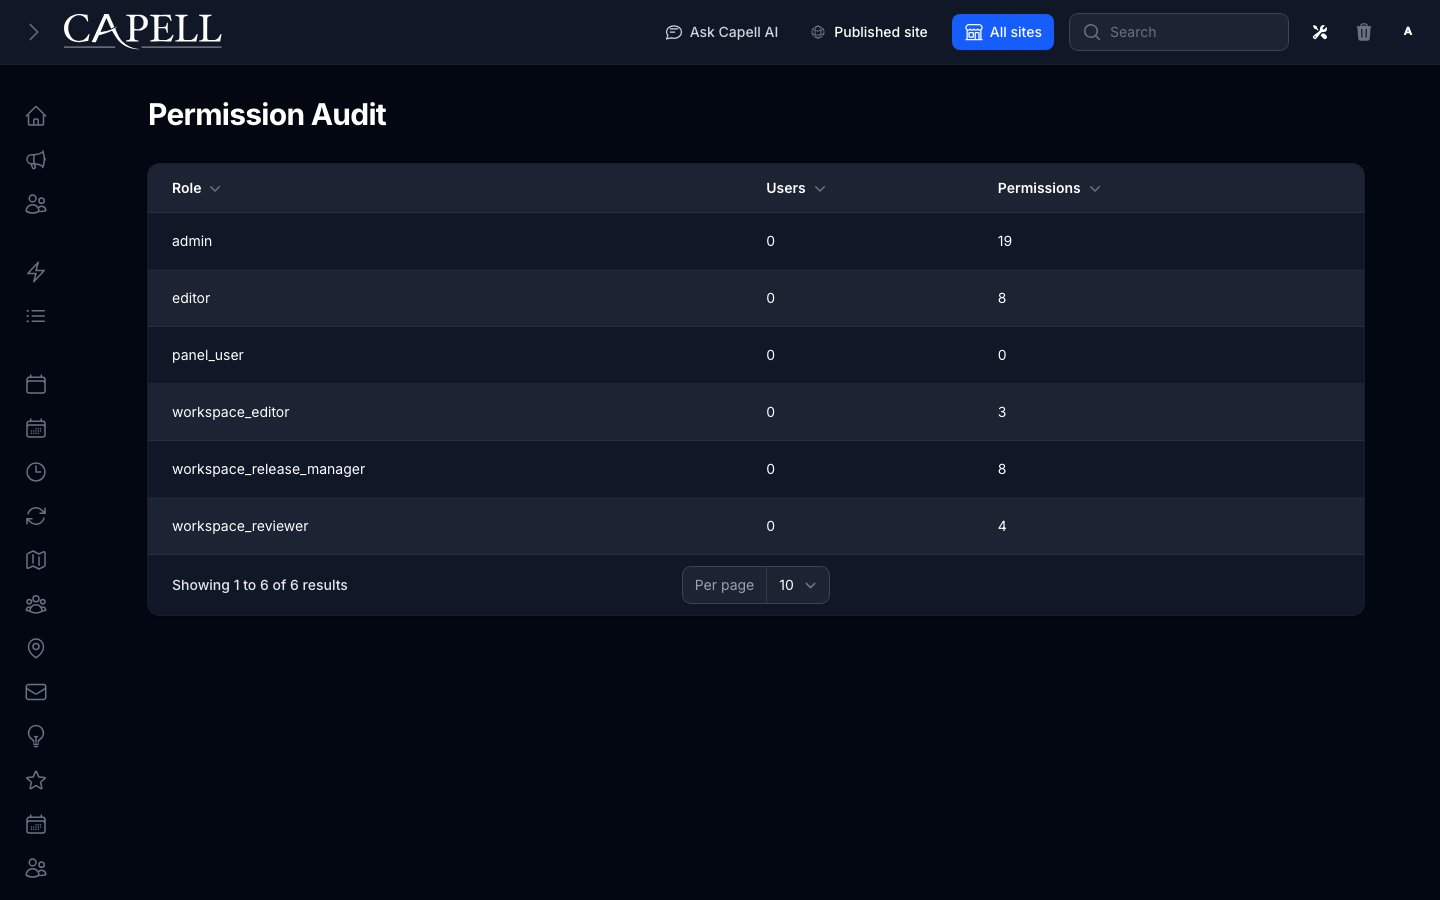
Section titled “How to audit permissions and roles”- Go to Permission Audit.
- Read the Permissions, Roles, and Users sections. Together they show which permissions are registered and how well your roles cover them.
- Run this audit after you install or remove a package, since that can change which permissions exist.
- If a permission looks uncovered or a role looks wrong, note it and work with your developer to adjust the roles.
How to check Queue Operations
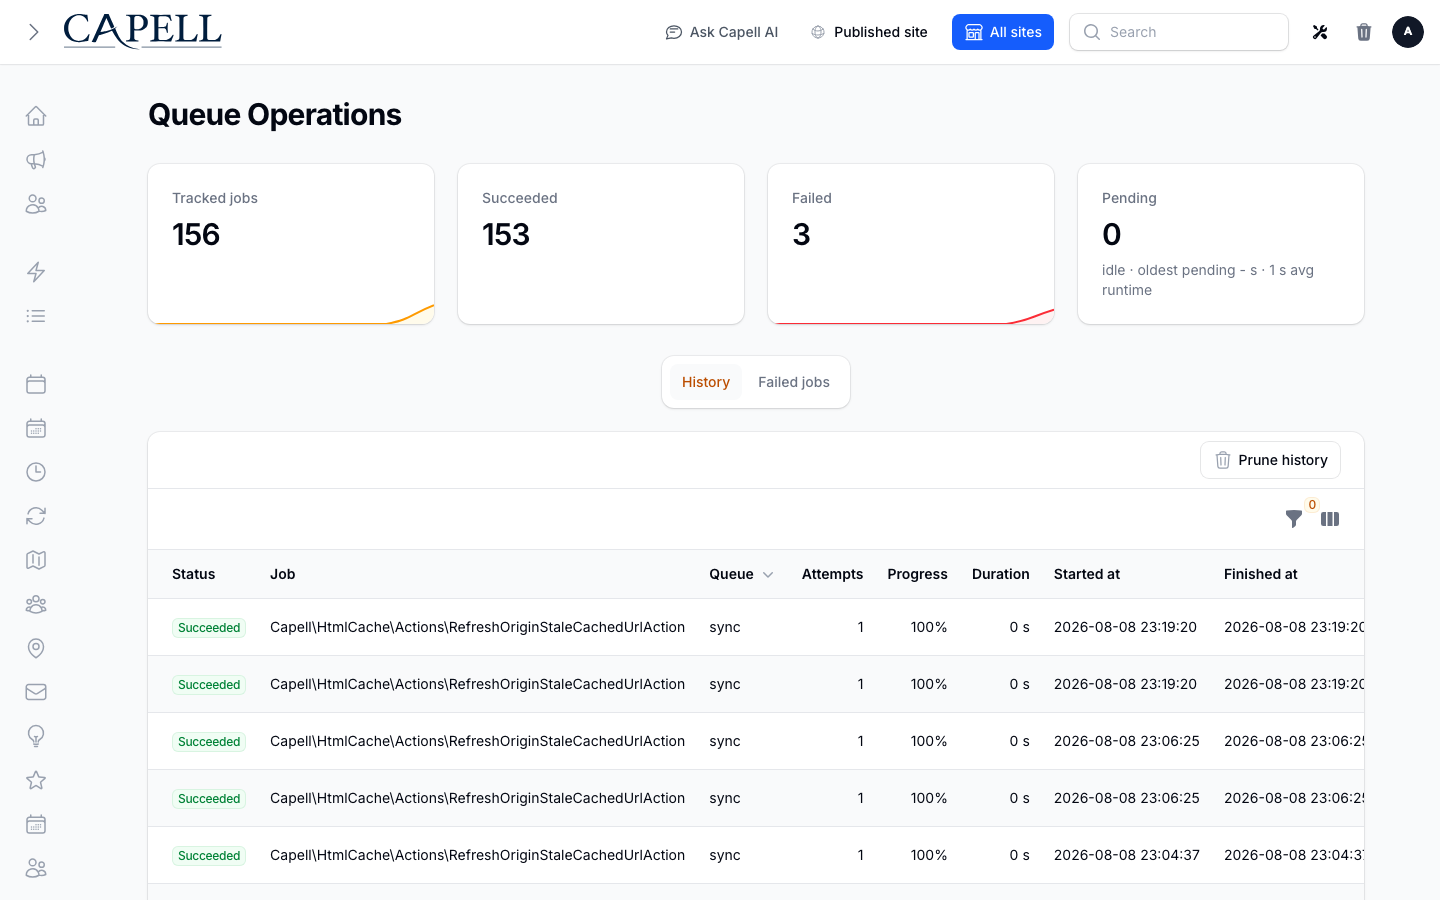
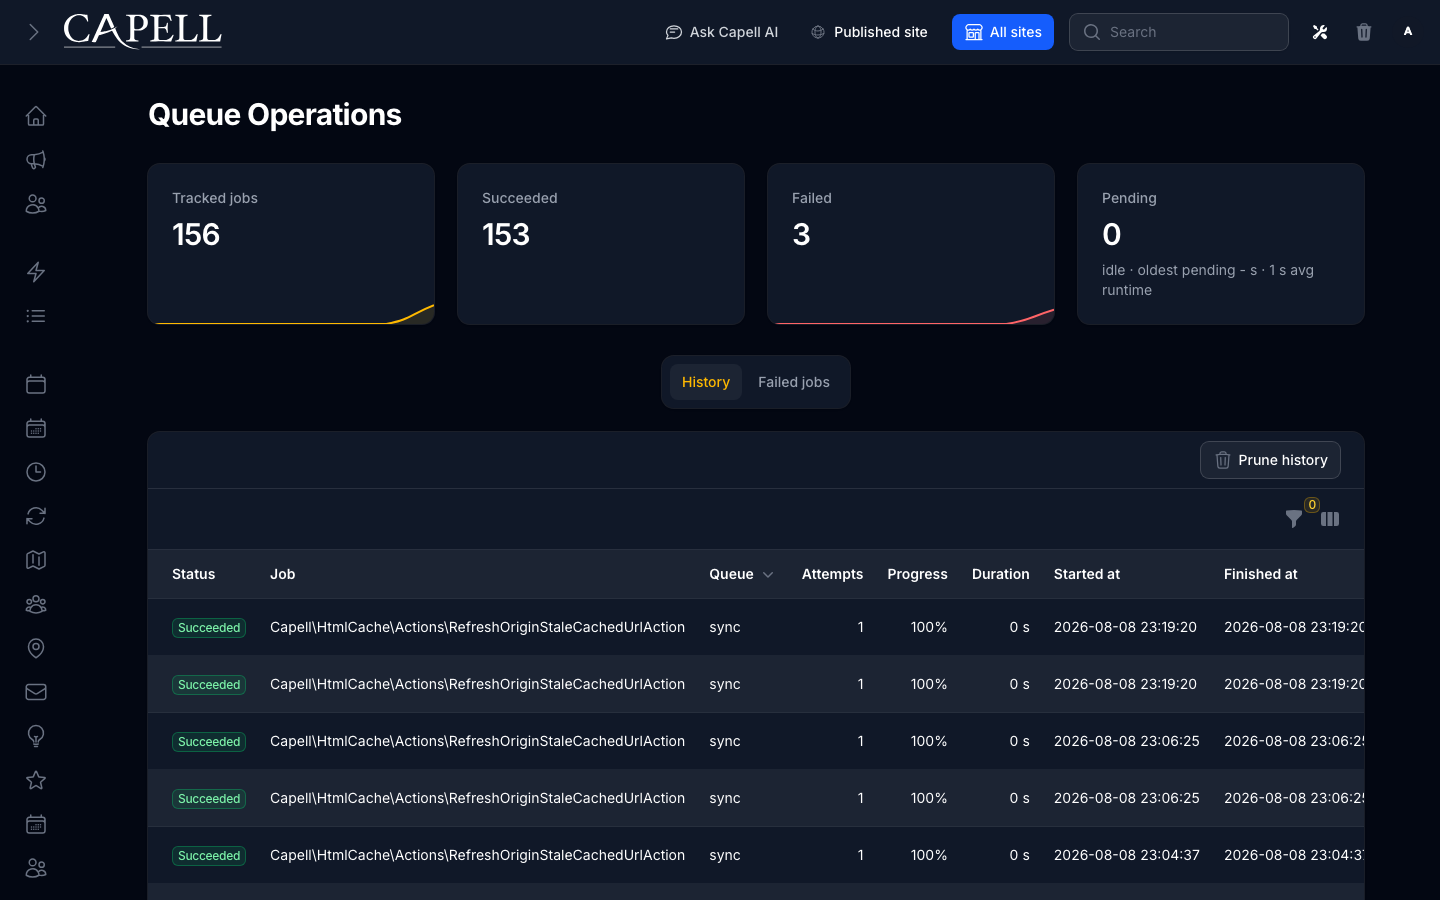
Section titled “How to check Queue Operations”- Go to Queue Operations.
- At the top, read the summary stats: Tracked jobs, Succeeded, Pending, and Failed. This is your quick health check for background work.
- Switch between the tabs History, Failed jobs, and Pending jobs to focus on what you need.
- Each row shows a job’s details, including Job, Status, Attempts, Duration, Started at, Finished at, Failed At, and Exception. A status can be Pending, Processing, Running, Succeeded, Failed, or Delayed.
- To narrow the list by date, use the From and Until filters.
To retry a failed job:
- Open the Failed jobs tab.
- Click Retry on a single job to run it again, or Retry failed jobs to retry them all at once.
To delete a pending job:
- Open the Pending jobs tab.
- Click Delete pending job on the job you want to remove. This stops it from running.
To prune history:
- Click Prune history.
- This clears out old tracked-job records so the list stays manageable. It does not affect jobs that are still waiting to run.
Rolling out Diagnostics (for owners)
Section titled “Rolling out Diagnostics (for owners)”Diagnostics is mostly a tool for the people who keep the site running. Decide who looks at it and who is allowed to act from it.
Start with the health widgets
Section titled “Start with the health widgets”- The health widgets on your admin dashboard and on System health are read-only. Anyone responsible for the site can read them safely. Make these the first thing your team checks when something seems wrong, before escalating.
Who does what
Section titled “Who does what”| Task | Who |
|---|---|
| Read the health widgets and System health | Operator or owner: safe to view, nothing can break |
| Warm the cache from Cache health | Operator: safe to run at any time |
| Read Migrations health and Config drift | Operator reads; applying migrations or fixing drift is a developer |
| Review Packages installed on Diagnostics | Operator or developer |
| Run a command from Command Palette | Developer: these run real commands, some make broad changes |
| Audit Permission Audit | Administrator reads; changing roles is a developer task |
| Act on Queue Operations (retry, delete, prune) | Operator or developer, depending on the job |
Read-only versus action
Section titled “Read-only versus action”- The health widgets only show you information. Reading them cannot change anything.
- The Command Palette and Queue Operations screens do take action. Use them deliberately, read the confirmation messages, and let your developer run anything marked as making broad or destructive changes.
Troubleshooting
Section titled “Troubleshooting”| What you see | What it means | What to do |
|---|---|---|
| A health panel is green | That area is healthy | Nothing to do |
| Setup health lists Items to complete: | Some setup steps are still outstanding | Work through each listed item until it shows “All setup requirements met!” |
| Cache health warns | Cached data may be out of date | Click Warm cache; if it still warns, note it for your developer |
| Migrations health shows Pending migrations | Database changes are waiting to be applied, usually after a deployment | Ask your developer to apply the pending migrations |
| Migrations health shows Orphaned registrations | A registered migration no longer matches the files on the site | Note it and pass it to your developer |
| Config drift shows missing | A key in the shipped config is absent from the host. Missing = key in shipped config absent from host | Send the drift details to your developer to reconcile the configuration |
| Config drift shows stale | A key in the host config is no longer shipped. Stale = key in host config no longer shipped | Send the drift details to your developer; when there is none it shows “No config drift detected” |
| Tailwind build status shows stale or never built | The site styles have not been built, or were built against older input | Ask your developer to rebuild; fresh means it is up to date |
| A package shows Not published under Config published | That package is using its shipped default configuration | Normal unless you meant to customise it; otherwise ask your developer to publish its config |
| A queue job shows Failed | A background job did not complete | Open Failed jobs, read the Exception, then click Retry or share it with your developer |
| Jobs are stuck on Pending or Delayed | Background work is not being processed | Share the Queue Operations view with your developer |
| A red check you do not understand | A check failed and the message is unclear | Send the panel name and its message to your developer |