
Using GA4 Reports
This guide is for owners and operators who want to read their Google Analytics numbers inside the admin. Once your analytics account is connected, the figures appear on a single page so you do not have to leave Capell to see how the site is doing. No technical knowledge is needed. Every step uses the labels you see on screen.
Using GA4 Reports (how-to)
Section titled “Using GA4 Reports (how-to)”How to open the reports page
Section titled “How to open the reports page”- In the admin sidebar, open the Monitoring group.
- Click GA4 Reports.
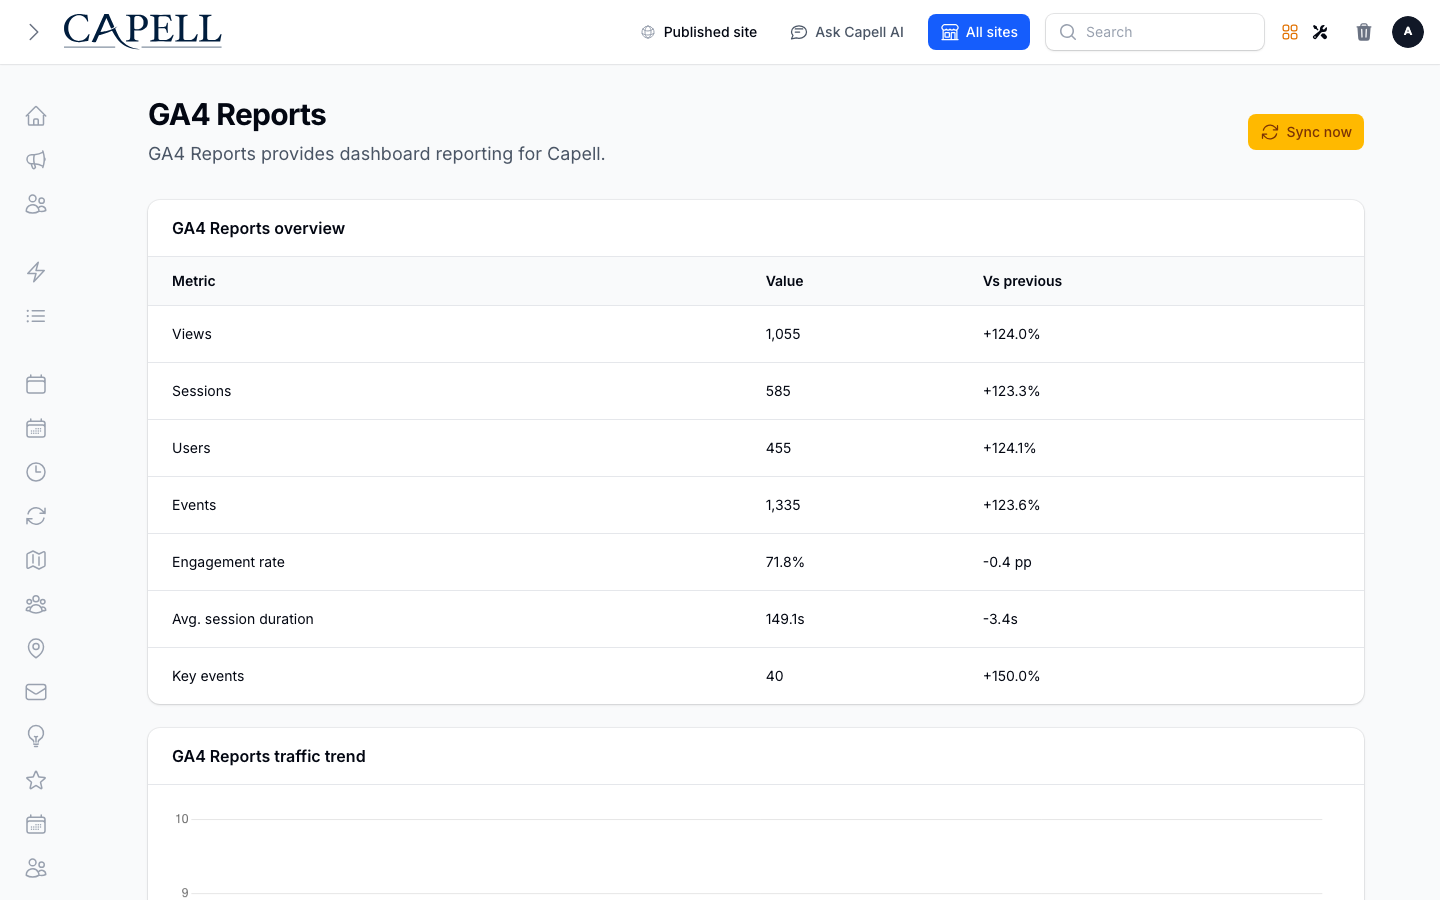
- The page shows your overview stats, a traffic trend, your top pages, and a setup status panel.
How to read the overview numbers
Section titled “How to read the overview numbers”- Open Monitoring > GA4 Reports.
- The GA4 Reports overview at the top shows headline figures such as Users, Sessions, Views, Events, Engagement rate, and Avg. session duration.
- Each figure also shows a Vs previous comparison, so you can see whether it went up or down against the period before.
- Below the overview, the GA4 Reports traffic trend plots visits over time, and Top GA4 pages lists your most-visited pages by Page path and Page title.
How to check whether analytics is connected
Section titled “How to check whether analytics is connected”- Open Monitoring > GA4 Reports.
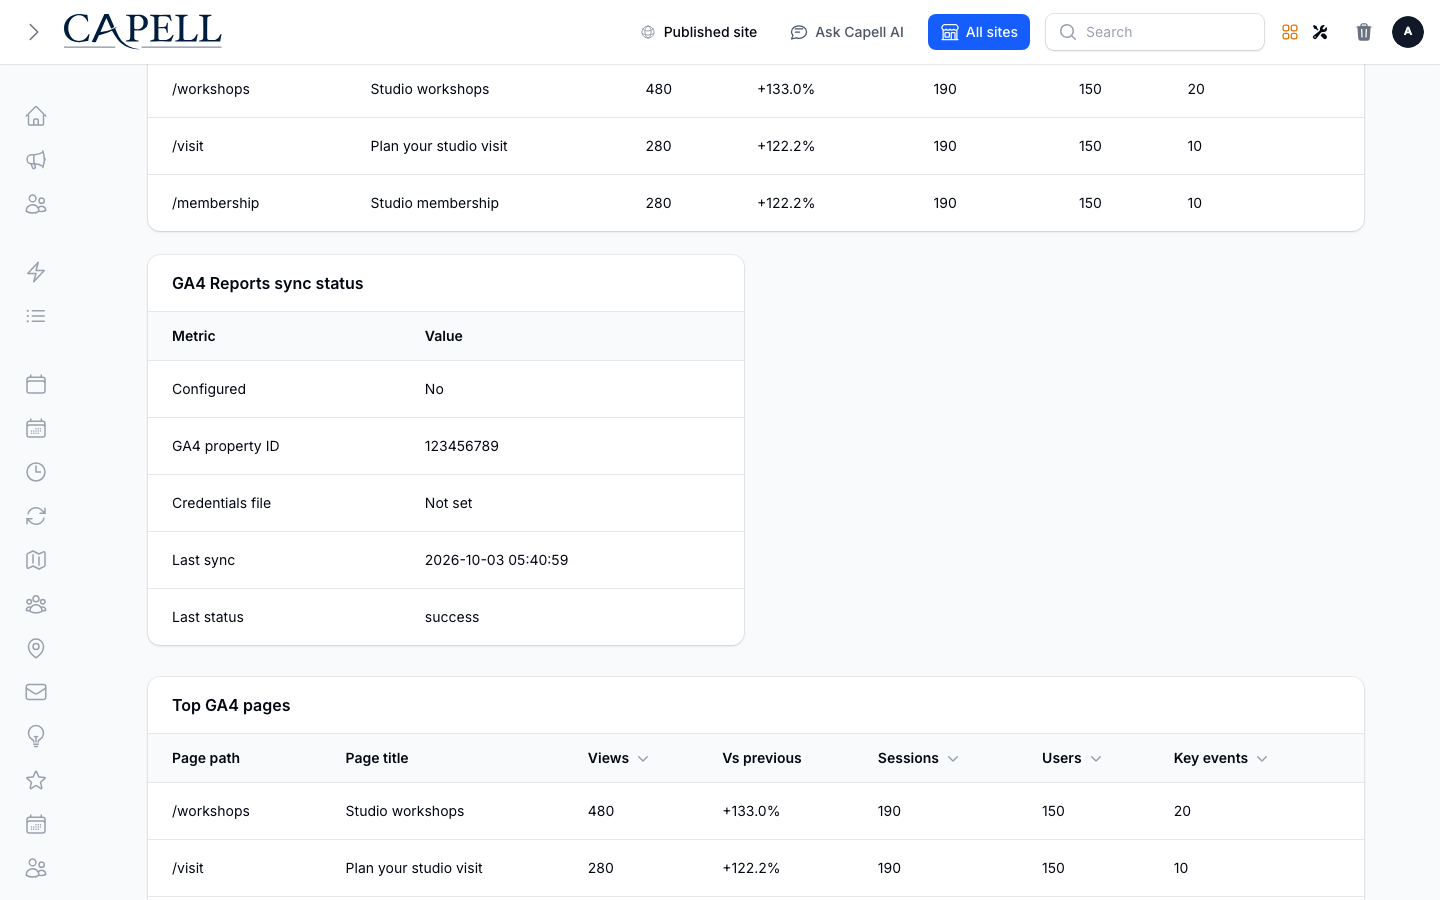
- Find the setup status panel. It tells you whether GA4 Reports is Configured, shows the Credentials file state, the Last status of the sync, the Last sync time, and any Last error.
- If it reports that GA4 Reports is not configured, no numbers will appear until you finish the settings below.
How to connect your Google Analytics
Section titled “How to connect your Google Analytics”- Go to Settings in the admin and find the GA4 Reports section.
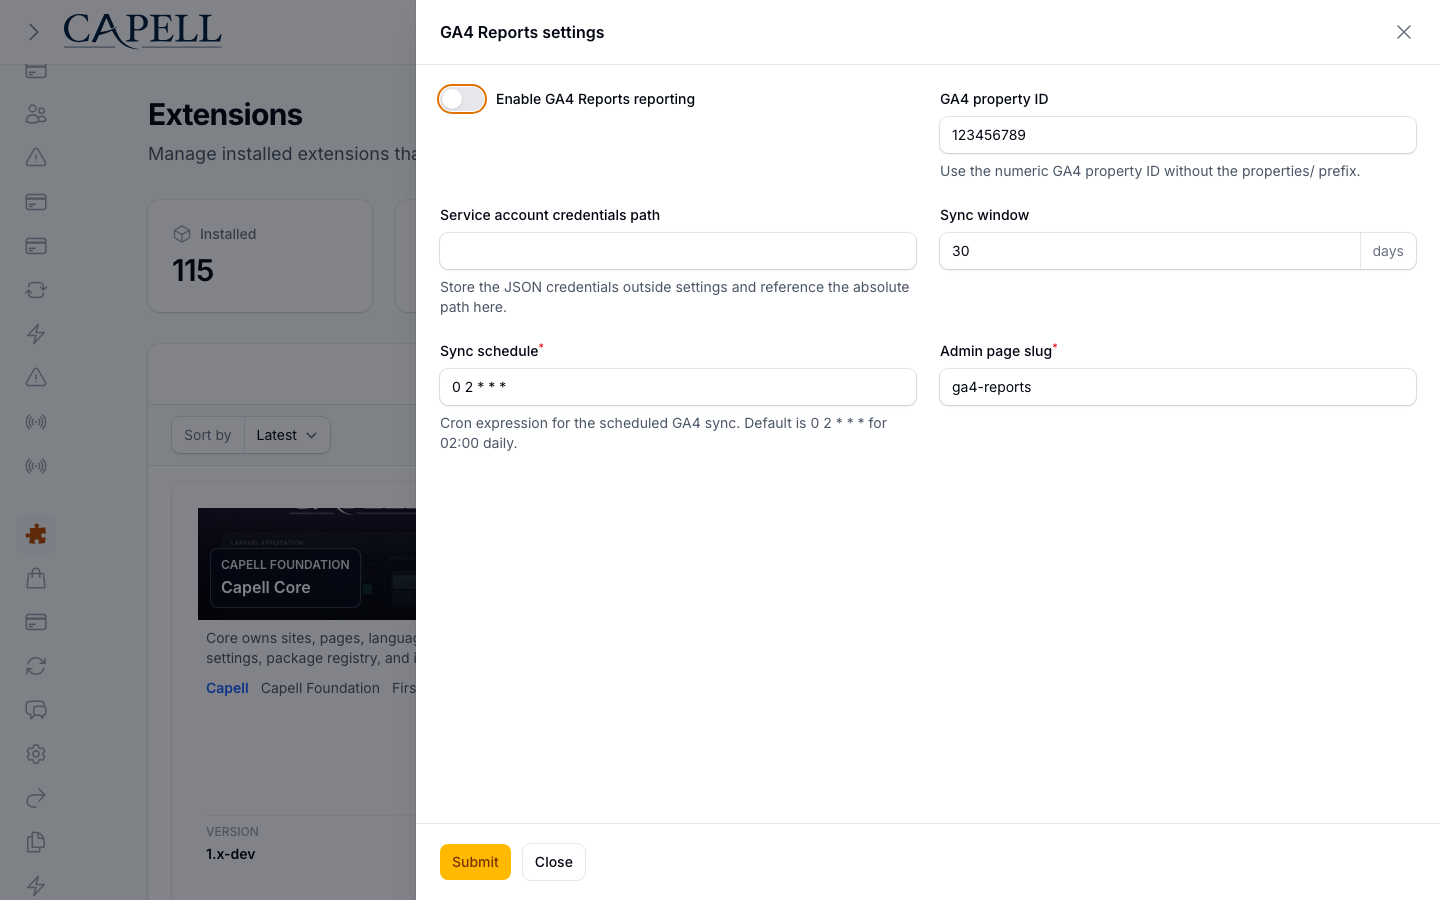
- Turn on Enable GA4 Reports reporting.
- Enter your GA4 property ID (the numeric property ID, without any prefix).
- Set the Service account credentials path to where the analytics credentials file is stored on the server. Ask your developer for this if you are not sure.
- Save the settings.
How to choose how much data and how often it syncs
Section titled “How to choose how much data and how often it syncs”- Go to Settings > GA4 Reports.
- Set the Sync window to control how many days of data the reports cover.
- Set the Sync schedule to the cron expression that controls how often the figures refresh from Google Analytics. The default refreshes once a day in the early morning; ask your developer for help if you do not work with cron schedules.
- If you want the reports page to live at a different address, change the Admin page slug.
- Save the settings.
How to refresh the numbers now
Section titled “How to refresh the numbers now”- Open Monitoring > GA4 Reports.
- Click Sync now.
- Wait for the success notification, then check that the Last sync time updates in the setup status panel.
- You do not enter any numbers by hand. They always come from Google Analytics on the schedule you set, and Sync now simply fetches the latest early.
Troubleshooting
Section titled “Troubleshooting”| What you see | What it means | What to do |
|---|---|---|
| No numbers appear on the reports page | GA4 Reports is not connected yet | Turn on Enable GA4 Reports reporting and fill in the GA4 property ID and Service account credentials path in Settings > GA4 Reports |
| The setup status shows a Last error | The last sync to Google Analytics did not work | Read the Last error text, then check the credentials path and property ID with your developer |
| Last sync shows Never | No sync has run since the connection was set up | Click Sync now, or wait for the next scheduled sync |
| A message says the sync is already running | A sync started by the schedule or another person is still in progress | Wait for it to finish, then check the Last sync time |
| The numbers look out of date | The latest scheduled sync has not run yet | Click Sync now to fetch fresh figures, or check the setup status panel |
| A metric is unfamiliar | The figure measures one part of visitor behaviour | Note what it measures before acting; for example Engagement rate is the share of sessions that were active |